
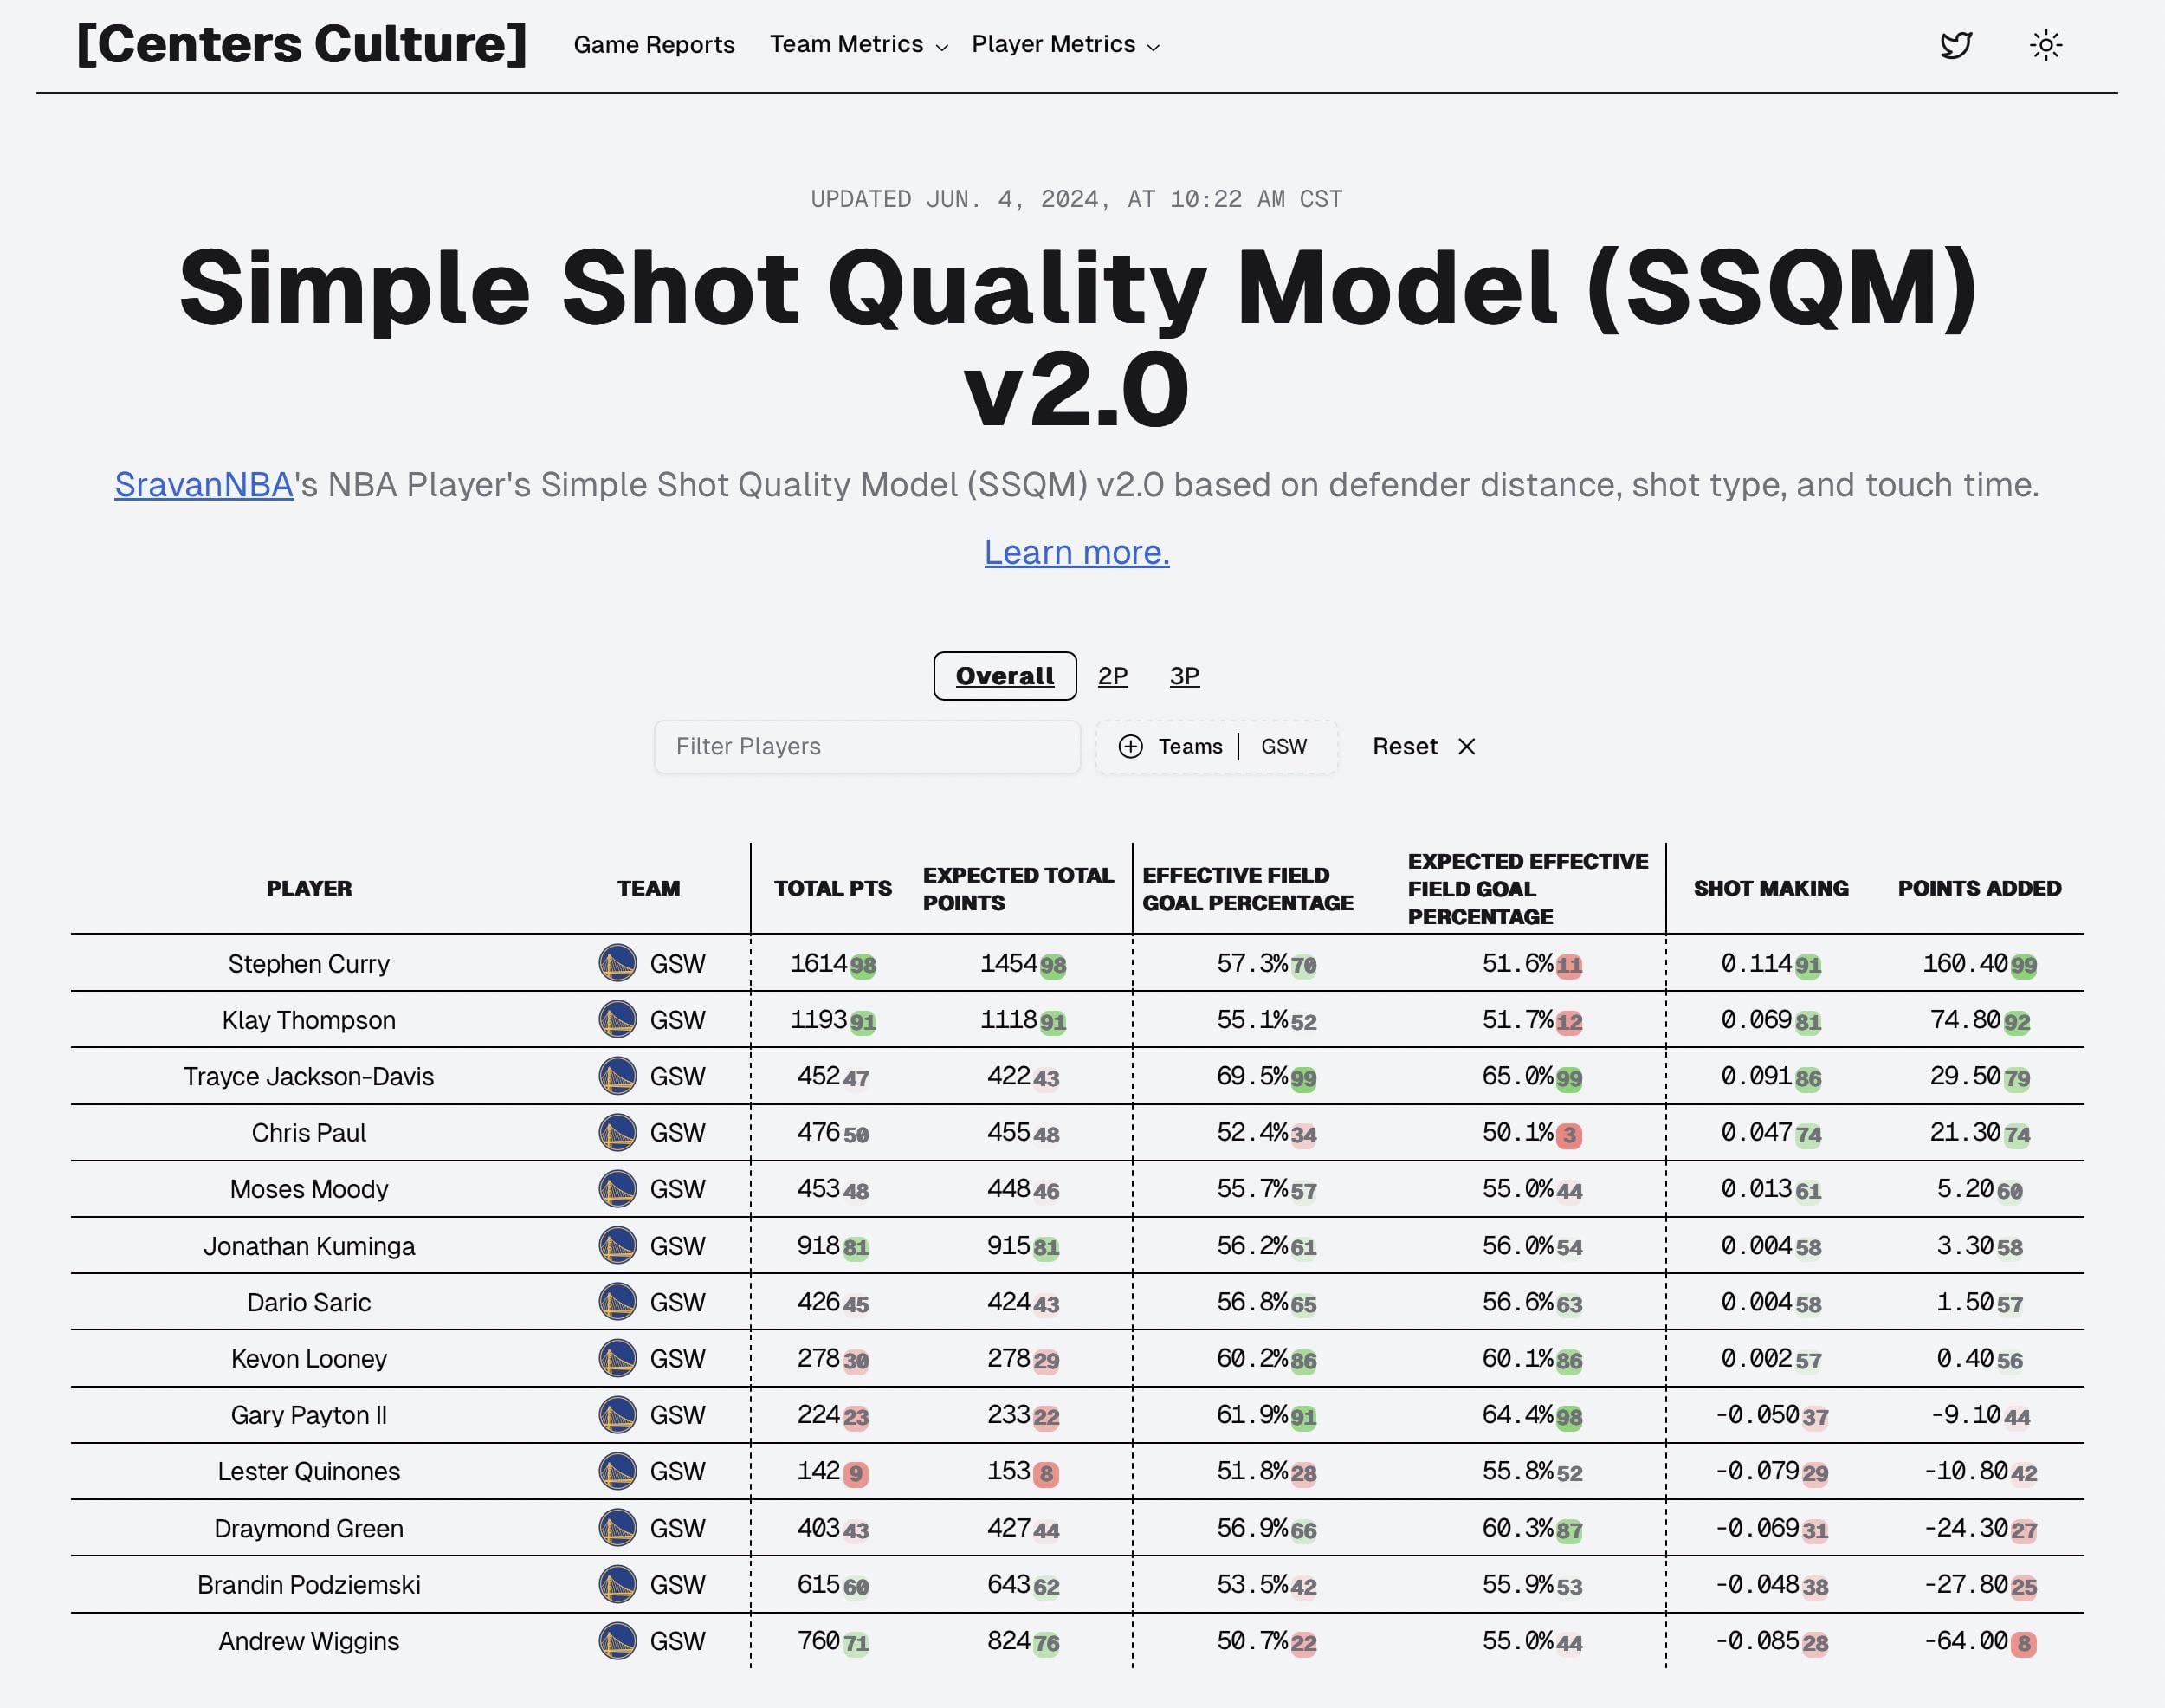
Note: The red and green number blocks next to each metric’s value is where that value falls within the league percentile. For example, Steph’s 160.40 Points Added value was among the 99th percentile in the league.
Sravan, a data analyst in the NBA analytics space who has created a bunch of really great tools, maintains a website of team and player analytics, which includes this really great shot quality model that provides the best publicly available shot quality stat metrics. The foundation for and explanation of the base model can be found here and the breakdown of what was upgraded with the v2 model (the model used for the stats in the screenshot) can be found here.
by taygads


4 Comments
Nothing really unexpected here, like Wiggins having a lot of <10feet shots or open looks and not making a high % of them
Klay had a lot of not great looks so his “expected” FG% would be pretty low.
Dray is always wide open on his threes so his 3PA don’t bring down his expected FG% much
This is good data to look at but without free throws it is not a full picture.
This chart is wrong off the rip.The total points are off by a bit for everyone?.
Klay could still be great if he had mediocre shot selection. He can’t afford to have a 12th percentile shot selection anymore, he isn’t on Curry’s level