


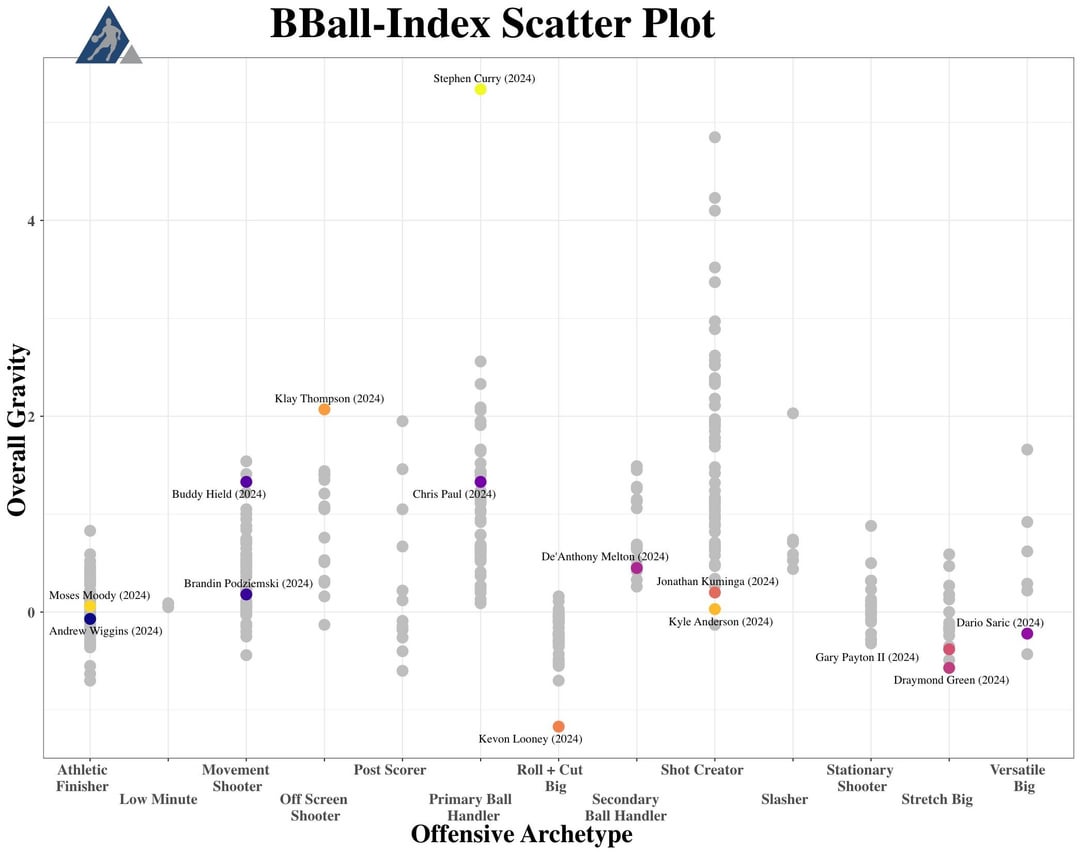


Each scatterplot includes last year's roster + this year's additions plotted based on where each fell along the spectrum last season of their offensive archetypes as assigned by Bball-Index. All of the greyed out dots along each offensive archetype's vertical axis are all of the other players in the league that last season and where they graded out on that metric. I chose the offensive metrics that I did with the aim of covering as many aspects of a team's offensive game as possible.
As mentioned above, each player's offensive archetype was designated and chosen by Bball-Index based on a detailed assessment of each player's game last season; I DID NOT choose these, so any issues anyone my have with these need to be taken up with Bball-Index lol. That said, here is how Bball-Index defines each of the Offensive Archetypes shown in the scatterplots:
Primary Ball Handler: these players used most like Guards, categorized as such based on their pick and roll ball handler and perimeter isolation scoring possessions, that don't isolate enough to be categorized as Shot Creators and have a higher percentage of their possessions on-court where they're estimated to be the initiator of the offense. Examples from 2019-20 are Kemba Walker and Rajon Rondo.
Secondary Ball Handler: also Guards based on the same math, these players similarly have lower isolation rates as the Primary Ball Handlers, but have lower estimated initiation rates for the offense. Examples from 2019-20 include D'Angelo Russell, Alex Caruso, and Donte DiVincenzo.
Shot Creator: players in this offensive role are non-Bigs that we identify as have high rates of perimeter and interior isolation rates, creating their own shots within the offense as a key skill set. Examples from 2019-20 are Luka Doncic and James Harden.
Slasher: Slashers are on-ball players that have a high tendency to drive to the rim. We use 3PA rates, drives per 75 offensive possessions on-court, and some play type data to calculate this role. Examples from 2019-20 include Collin Sexton and De'Aaron Fox.
Athletic Finisher: these players, as opposed to Slashers, are off-ball Guards/Wings that do damage at the rim through their cutting and activity on putbacks. Examples from 2019-20 are Jonathan Isaac and OG Anunoby.
Off Screen Shooter: players in this role are Guards/Wings that have a high proportion of their offensive scoring possessions coming from off-screen and handoff play type possessions. Examples from 2019-20 are Joe Harris and JJ Redick.
Movement Shooter: these players are primarily shooters based on their 3PA rates, but do so often while moving around the court based on our estimations rather than being off-screen or stand still shooters. Examples from 2019-20 are Svi Mykhailiuk and Danny Green.
Stationary Shooter: guys here have high 3PA rates, but our estimations show these guys to be shooters mostly from catching & shooting standing still, rather than moving to get themselves open for their shots. Examples from 2019-20 include Eric Gordon and Cedi Osman.
Stretch Big: these players are Bigs that have lower post up rates and higher 3PA rates. Examples from 2019-20 are Marc Gasol and Frank Kaminsky.
Versatile Big: players in this category are Bigs that do it all. They'll shoot 3s, post up, and be active with other Big man actions (roll man opportunities, putbacks, cuts, and dump offs). Examples from 2019-20 are Karl-Anthony Towns and Kevin Love.
Post Scorer: here we find Bigs that don't have high 3PT attempt rates and have particularly high post up possession usage. Examples from 2019-20 are Nikola Jokic and Joel Embiid.
Roll & Cut Big: our last category of Bigs belong to players with low post up and low 3PA rates. That leaves us with guys primarily adding value with their rolling, cutting, and ability to finish dump offs. Examples from 2019-20 are DeAndre Jordan and Clint Capela.
Below is a breakdown of each of the Bball-Index offensive metrics for which I created scatterplots for. Again, I chose the metrics I did with the aim of the whole gamut of a team's offense, e.g. shooting, playmaking, shot creation, spacing (gravity metrics), etc. All of the definitions below come from Bball-Index's glossary, so when you read things like 'we' or 'our' that's referring to Bball-Index.
Stable Metrics (applies to the Stable PTS per 75) – These metrics use a similar padding approach as described here (and what we use for LEBRON) to make metric performance more predictive. This is done by infusing the actual sample of performance in the area of question with an expected performance sample.
Overall Shooting Talent – Shooting Talent takes into account a player's shot making, shot quality, and shot creation. These factors help provide context that box score shooting percentages are lacking. Shooting talent can be sliced and diced to isolate specific skill sets such as: 3PT Shooting Talent, Mid-Range Shooting Talent, Finishing Talent, Half Court Shooting Talent, and Transition Shooting Talent. Each of these shooting skill sets incorporate the following in their calculations:
- Shot Making – Each of our Shot Making metrics evaluate player shooting proficiency while accounting for shot quality in the given area.
- Shot Quality – Shot Quality measures how difficult a player’s shot attempts are. It accounts for shot location, type, defense, and movement.
- Shot Creation – Shot Creation measures how often a player self-generates shot attempts.
On-Ball Gravity – This metric aims to measure how much attention and resources a team uses trying to defend a player while on-ball. Players with high On-Ball Gravity are ones we’d expect to see double teamed more often than others and see more aggressive screen coverages to get the ball out of their hands.
Off-Ball Gravity – This metric aims to measure how much attention and resources a team uses trying to defend a player when they don’t have the ball. Players that are stronger 3-point shooters will do better in this metric, and if players are able to shoot off movement and utilize off-ball screens to generate 3-point attempts they’ll tend to grade out higher in this metric.
Playmaking Talent – Our Playmaking Talent grade analyzes a player’s playmaking for teammates through their ratings in Passing Creation Volume, Passing Creation Quality, Passing Versatility, Passing Efficiency, and On-Ball Gravity (which has a small weight). This metric is designed to be as context-neutral as possible, enabling values more accurately capturing true playmaking talent and resulting in stability from year to year, even with players changing teams.
- Passing Creation Volume – Passing Creation Volume looks at a player's potential assists per 75 possessions. Potential assists are given regardless of if a teammate makes or misses a shot after receiving a pass. We pad these rates to regress smaller samples back towards the average. These values are represented using z-scores.
- Passing Creation Quality – Passing Creation Quality analyzes playmaking ability through the quality of scoring opportunities a player creates for their teammates through their passing. Regardless of whether the teammates makes or misses the look generated. Data used to calculate Passing Creation Quality includes the location of assists, as well as conversion rates on potential assists for players relative to rates for those same players passed to from other teammates and league average on types of scoring looks.
- Passing Versatility – Passing Versatility analyzes a player’s playmaking ability by quantifying how full the passing repertoire is for a player by looking at Synergy passing data from scoring play types as well as SportRadar data on assist locations. This allows us to gauge who has the most range and versatility in their pass types. A player may have excellent performance within their passing style but not have the range as a playmaker to make other kinds of passes (kick outs on drives, etc.). This metric identifies that spread of playmaking versatility and rewards players who are more versatile. Several tiers of spread are identified through the data, which is why you’ll see groups of players with the same values. The higher the spread, the fewer players you’ll see in the tier. These values are represented using z-scores.
- Passing Efficiency – Passing Efficiency analyzes how well a player takes care of the ball as a passer, and does so by comparing rates of bad pass turnovers with expected rates, given the player's ball dominance, how often they're generating shots for teammates (via Passing Creation Volume), the quality of those shots (via Passing Creation Quality), and the versatility in pass types executed (via Passing Versatility). If you look just at turnover rates, you're lumping in a lot of turnovers that have nothing to do with passing. If looking just at rates of bad pass turnovers, real playmakers will naturally look worse and players rarely creating for others will look better. To be holistic in capturing all of that, we establish the baseline of what's expected, given a player's playmaking ask, to compare with instead and enable smarter analysis.
by taygads


10 Comments
Meant to note this in the body of the post, but reading it back now I realized I left it out. The reason I included last year’s roster alongside the new additions is to provide points of reference for judging where we’ve improved, or not, from last season.
There aren’t question marks imo. Without Steph, this would be one of the 2-3 worst teams in the NBA.
This isnt that complicated. Defense is far more important building around steph than building around offense. when we have a top 3 defense in the league paired with the greatest offensive player in our generation, we have a shot at a title.
I was gonna upvote and then saw this was a taygads post and I don’t want to support his weird crusade
Last year we ranked like 7th in offense and 19th in defense. I think our offense can actually be better this year (sorry Klay), while our defense should almost certainly be improved.
So how come the guy who took over the C spot in the 2nd half Trayce Jackson-Davis included?
E: Also how come Gui and Lindy (and since you are including the last year roster’s guys Quinones & CoJo) not included in the graphs?
u/taygads did you have to individual search for players? I ask bc TJD should be here somewhere. Bey the end of the year he was putting up 10 ppg pretty consistently.
It’s not just that individually none of our players other than Steph are very good on offense, it’s that their skill sets are awful with each other. There’s no spacing. There’s no shot creation. Little ball handling. Little size. It’s just really bad
I’m convinced they will make a move before all star break. We got the roster to make some good trades.
But we are fairly stout defensively although still quite small. Offense….its gonna be ugly. Steph double teamed full court. Endless box and ones. Constant traps. He’s gonna risk injury.
So….Klay is generally one of the best off screen shooters in the NBA. And his gravity is off the charts. And if he’s the one other player who was being double teamed…..