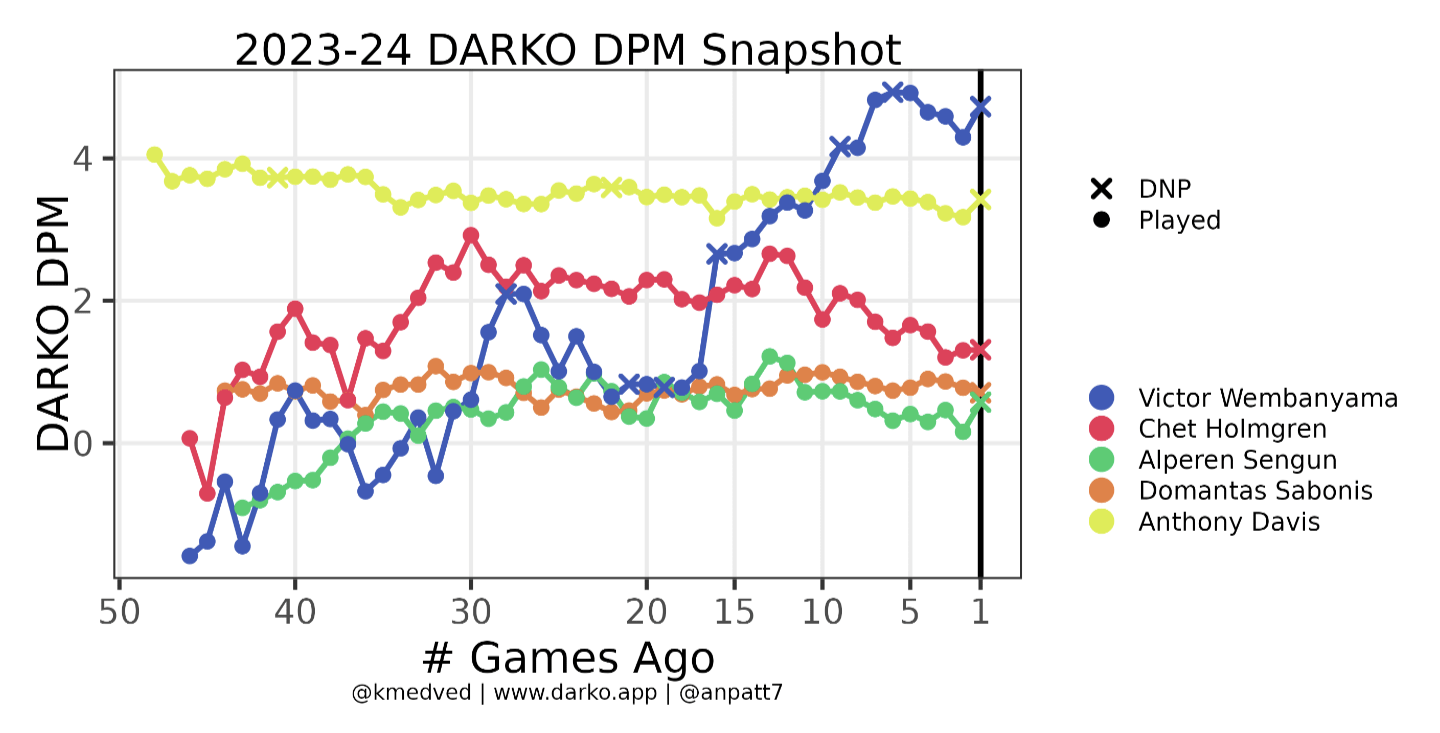
That big jump 20 games ago was around the time when Zach Collins got benched and Wemby moved to the 5. And the other mini jump more recently was when Tre became a starter
CrissCrossAppleSos
Usually I’d think it’s variance, but Wemby’s shot diet has changed a bunch. He’s still taking some bad shots, but it’s nowhere near the same extent. He’s got rid of some Durant and added some Deandre Jordan and it’s been fantastic for his production
samlet
I mean, in January (13 games), Wemby’s stats per 30 minutes are 27.5/11.1/3.8 with 3.6 blocks and .9 steals, shooting .509/.318/.821 for a .605 TS%. That’s basically prime Anthony Davis, with more shotblocking but more TOs.
And he’s played that well the whole season when playing at C with a natural point guard in Tre Jones, so it seems significant to me.
If Wemby keeps this up (which I fully expect him to) he’ll be an All-NBA-level player at age 20, which hasn’t been seen since LeBron, and before that Shaq, and before that Magic. For someone hyped as the greatest prospect since LeBron he’s fully lived up to it.
justwannasleepplease
What exactly is this graph telling us? I’m not familiar with advanced stats at all


4 Comments
That big jump 20 games ago was around the time when Zach Collins got benched and Wemby moved to the 5. And the other mini jump more recently was when Tre became a starter
Usually I’d think it’s variance, but Wemby’s shot diet has changed a bunch. He’s still taking some bad shots, but it’s nowhere near the same extent. He’s got rid of some Durant and added some Deandre Jordan and it’s been fantastic for his production
I mean, in January (13 games), Wemby’s stats per 30 minutes are 27.5/11.1/3.8 with 3.6 blocks and .9 steals, shooting .509/.318/.821 for a .605 TS%. That’s basically prime Anthony Davis, with more shotblocking but more TOs.
And he’s played that well the whole season when playing at C with a natural point guard in Tre Jones, so it seems significant to me.
If Wemby keeps this up (which I fully expect him to) he’ll be an All-NBA-level player at age 20, which hasn’t been seen since LeBron, and before that Shaq, and before that Magic. For someone hyped as the greatest prospect since LeBron he’s fully lived up to it.
What exactly is this graph telling us? I’m not familiar with advanced stats at all